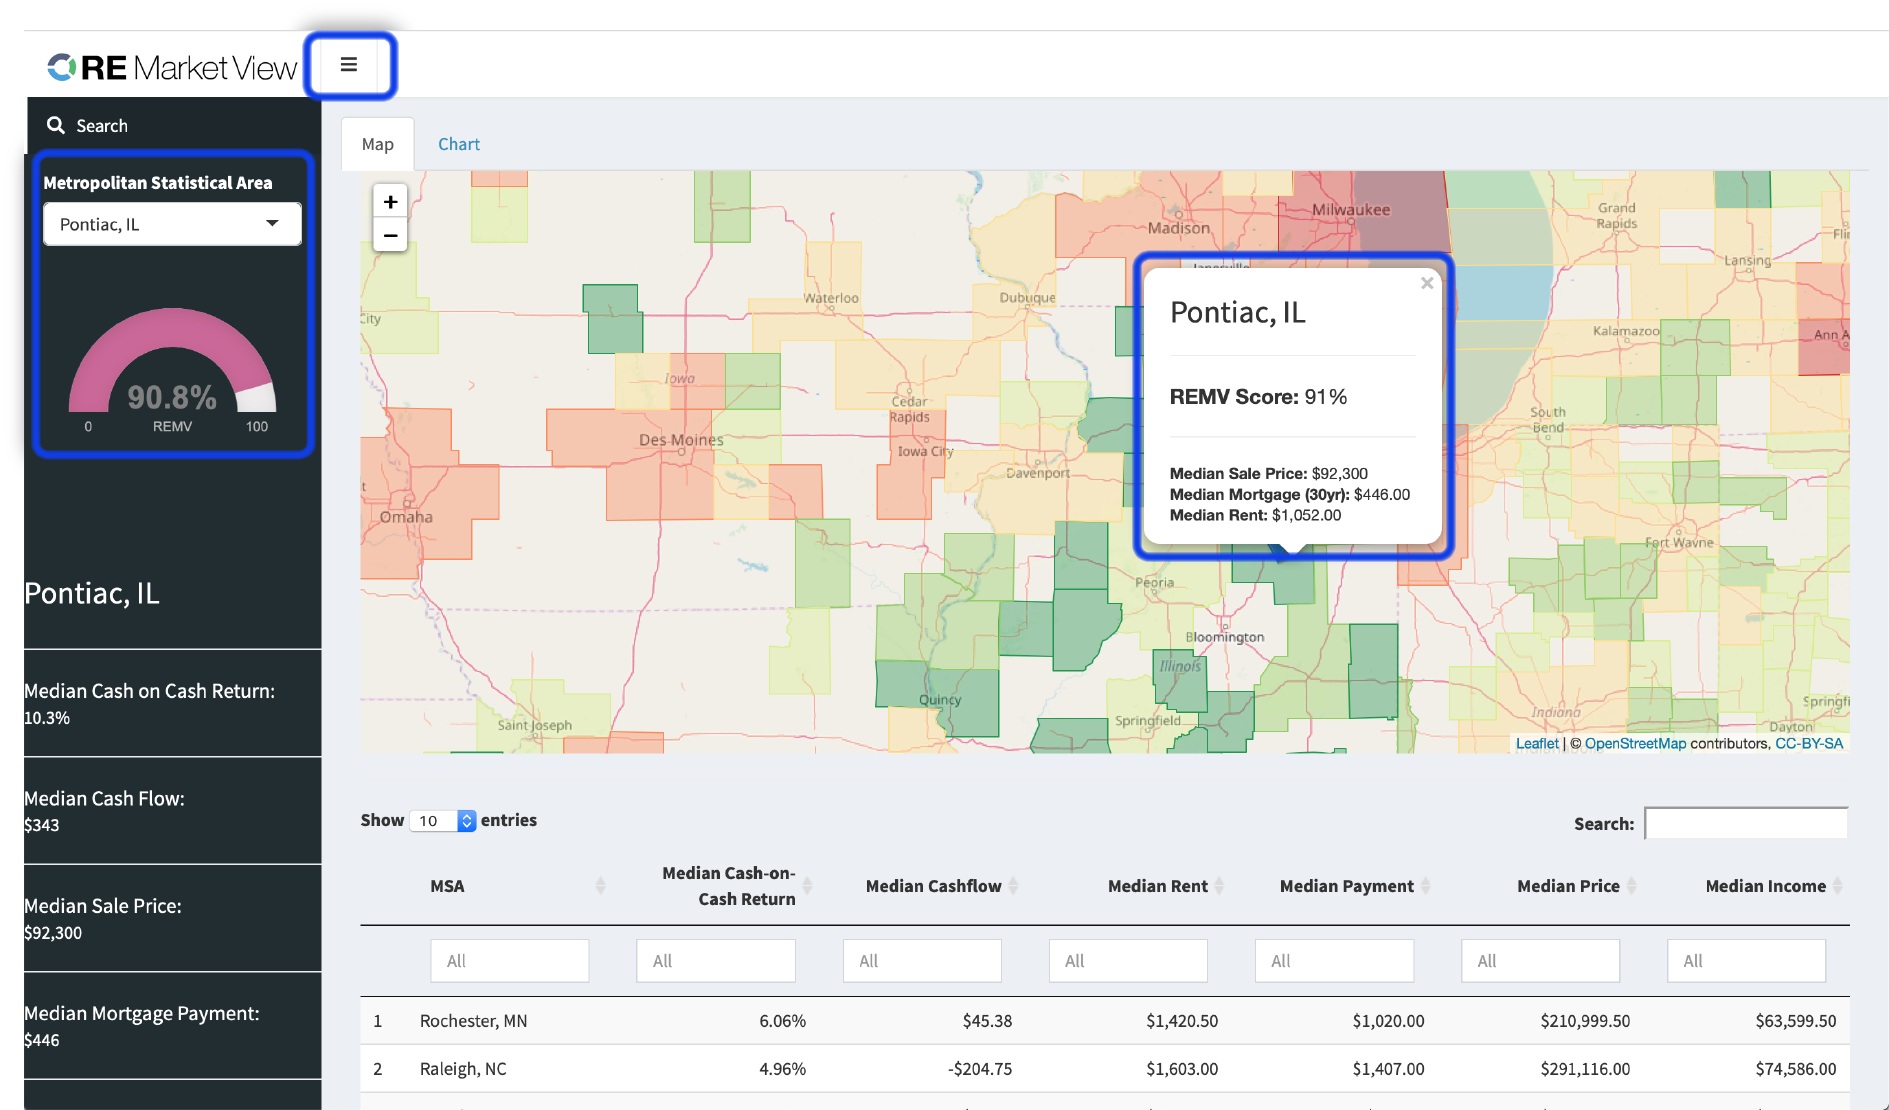
How to Use: 


Screen Shot 2019-06-26 at 10.49.50 AM.png

REMV SCORE

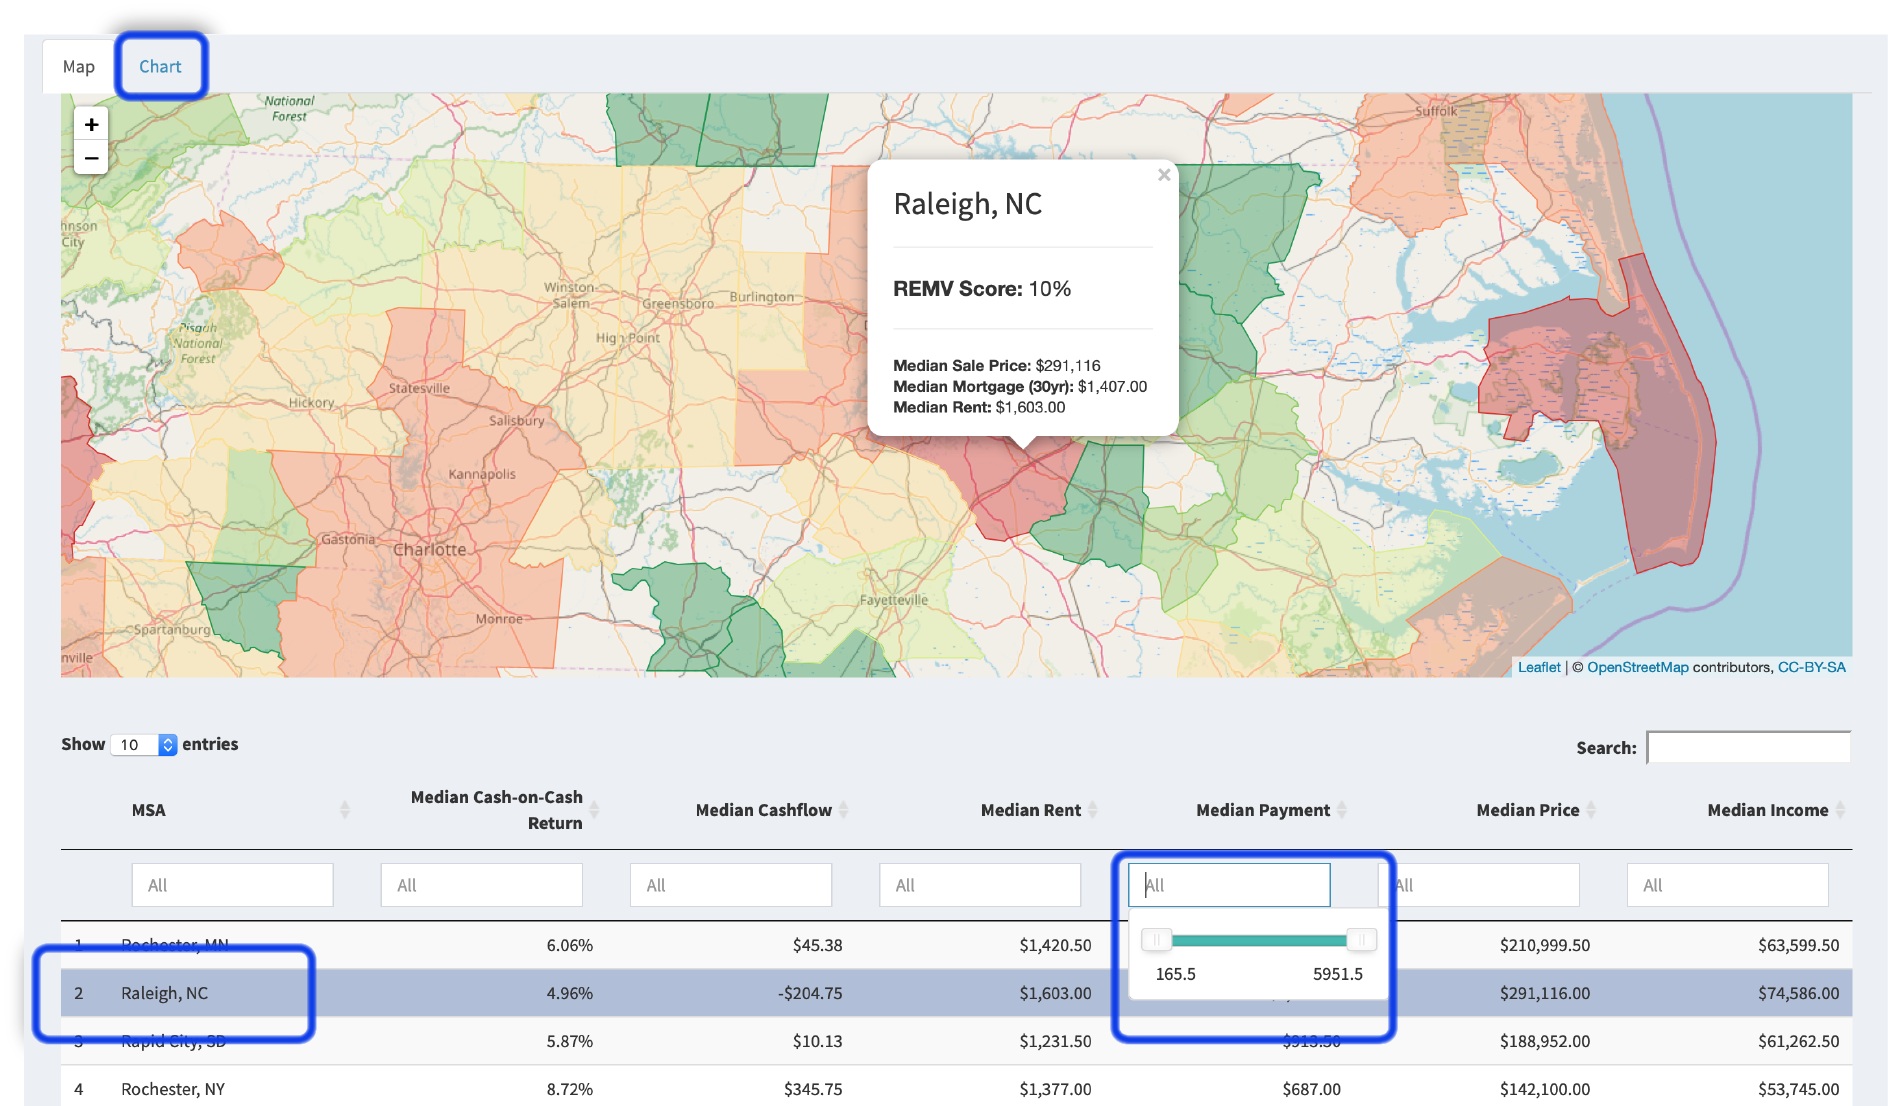
The REMV score ranks each market from 0-100 according to cash flow, cap rate, appreciation, affordability, and population demographics.

Green areas on the map indicate a higher REMV score, while red indicates a lower REMV score.


Map


Use RE Market View to find the top zip codes to invest in residential real estate! Search by cap rate, cash flow, rent, and more!


howto1.jpg

Search

Begin you search in the top left to select MSA and view summary data in sidebar, or navigate to map and click on region.

Navigate Map

Once you click a region on the map, a popup appears with a market summary. Click the menu in the top left to hide the sidebar search, or navigate to the table below and select a row to locate on the map.

 
howto2.jpg

Select row

Selecting a row in the table below will zoom the map to that region. Sort each column or filter to narrow your search.

Filter and Search

Filter each of the columns in the table below the map to narrow your search, or use the search bar directly above the table to the right.


Chart


RE Market View charting overview and tips for real estate investors. Visit remarketview.com to find the best markets to invest in, 100% free.


howto3.png

Search

Use the same sidebar search on the right to search region and visualize historic market data and identify market cycle. Analyze Cash Flow using the blue bar chart below.

Market Cycle

Buy-Hold, Buy -Flip, and Speculative market cycles can be visualized over time in the top plot by the colors green, yellow, and red. Visualize other data over time such as median sale price, mortgage payment, rent, and more.

Screen Shot 2019-06-26 at 12.20.51 PM.png
 
Screen Shot 2019-06-26 at 12.21.10 PM.png

Data Display

Clicking on the name of the data in the legend below will hide/display it from the chart. The solid lines use the left y-axis, while the dotted lines use the y-axis on the right. Both top and bottom charts share the same “Date” x-axis.

Chart tools

Use the tools in the top right of the chart to zoom in/out, display data on the chart, take a snap shot, or reset the chart display.


Visit our Data Overview to learn more about the data.